Stop Cyber-Attacks Before They Happen
CyberHQ®'s maps real-world attack scenarios to your specific environment, your relevant threat actors, and your most critical business services. Start prioritizing by what would actually take your operations down.
AI-Driven Attack Simulation
MITRE ATT&CK Control Mapping
Business Service Impact Mapping
Attack Path Analysis
Continuous Threat Intelligence
Threat Informed Board Reporting
Trusted by
Every Security Investment is Defensible
CyberHQ® shows exactly which controls are stopping real-world attack techniques and which are not. When your board asks where the next security dollar should go, the answer comes from simulated attack outcomes, not gut feel or vendor recommendations.
CM-7(1)-0: Do you review your information system consistently to identify unnecessary and/or nonsecure functions, ports, protocols, and services?
SI-4(13)-0: Do you analyse communications traffic/event patterns for your information system?
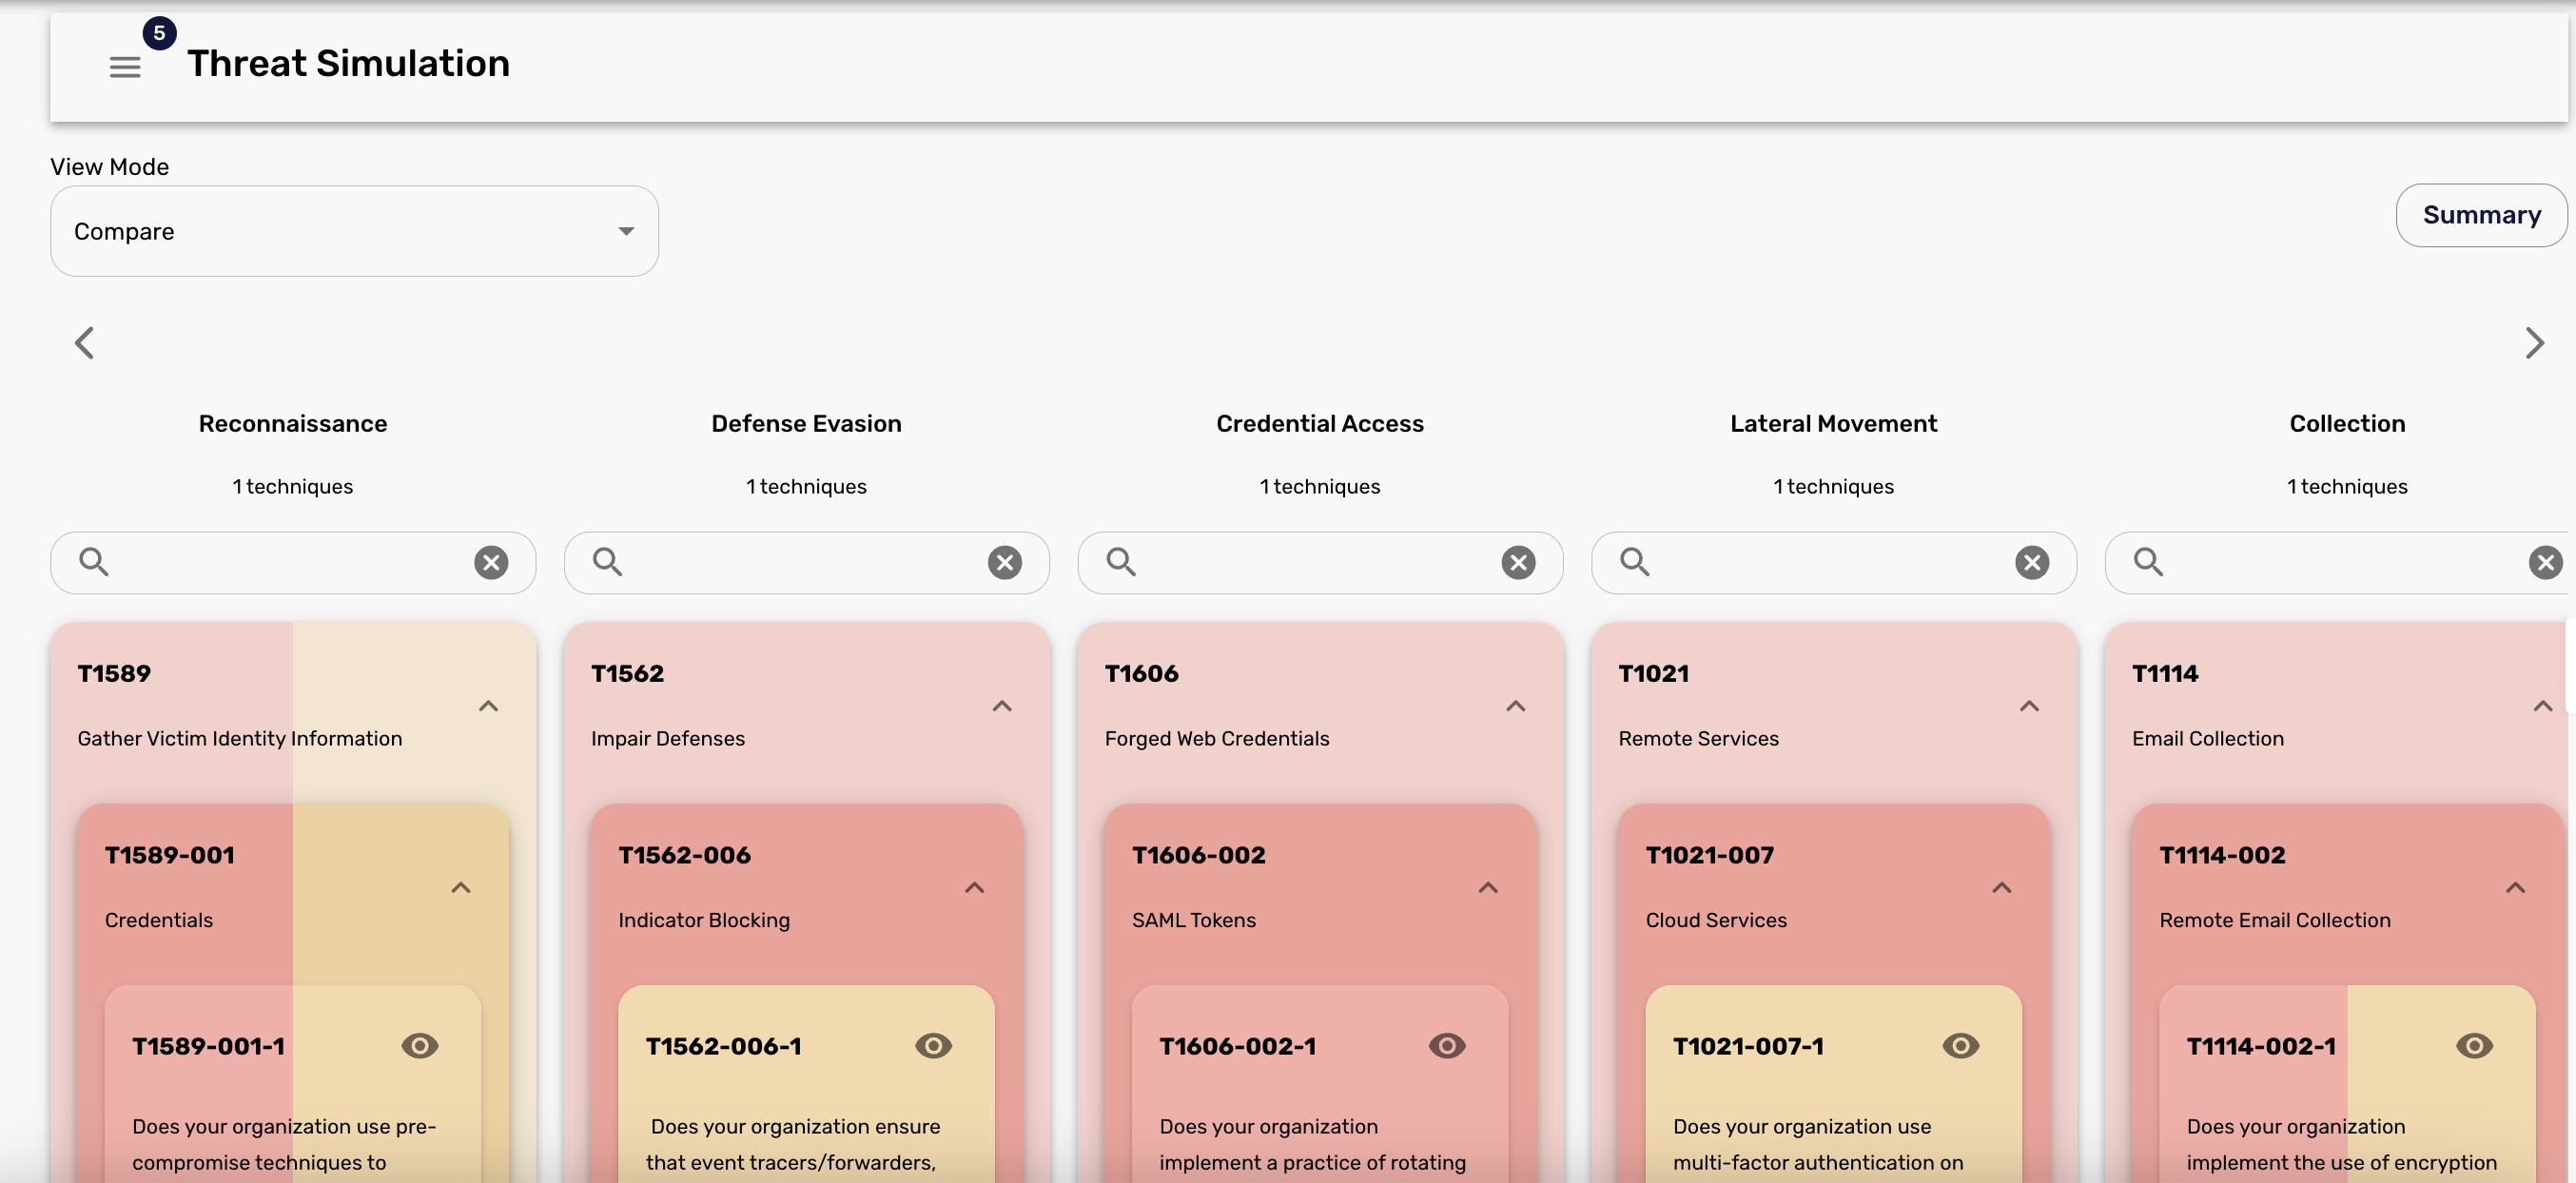
T1588
Obtain Capabilities
T1588-006
Vulnerabilities
T1588-006-1
Does your organization employ pre-compromise techniques to mitigate potential vulnerabilities that adversaries may exploit during targeting?
T1486
Data Encrypted for Impact
T1486-001
Data Encrypted for Impact
T1486-001-1
Does your organization enable cloud-delivered protection and Attack Surface Reduction (ASR) rules to block the execution of files that resemble ransomware on Windows 10?
See controls, evidence & more
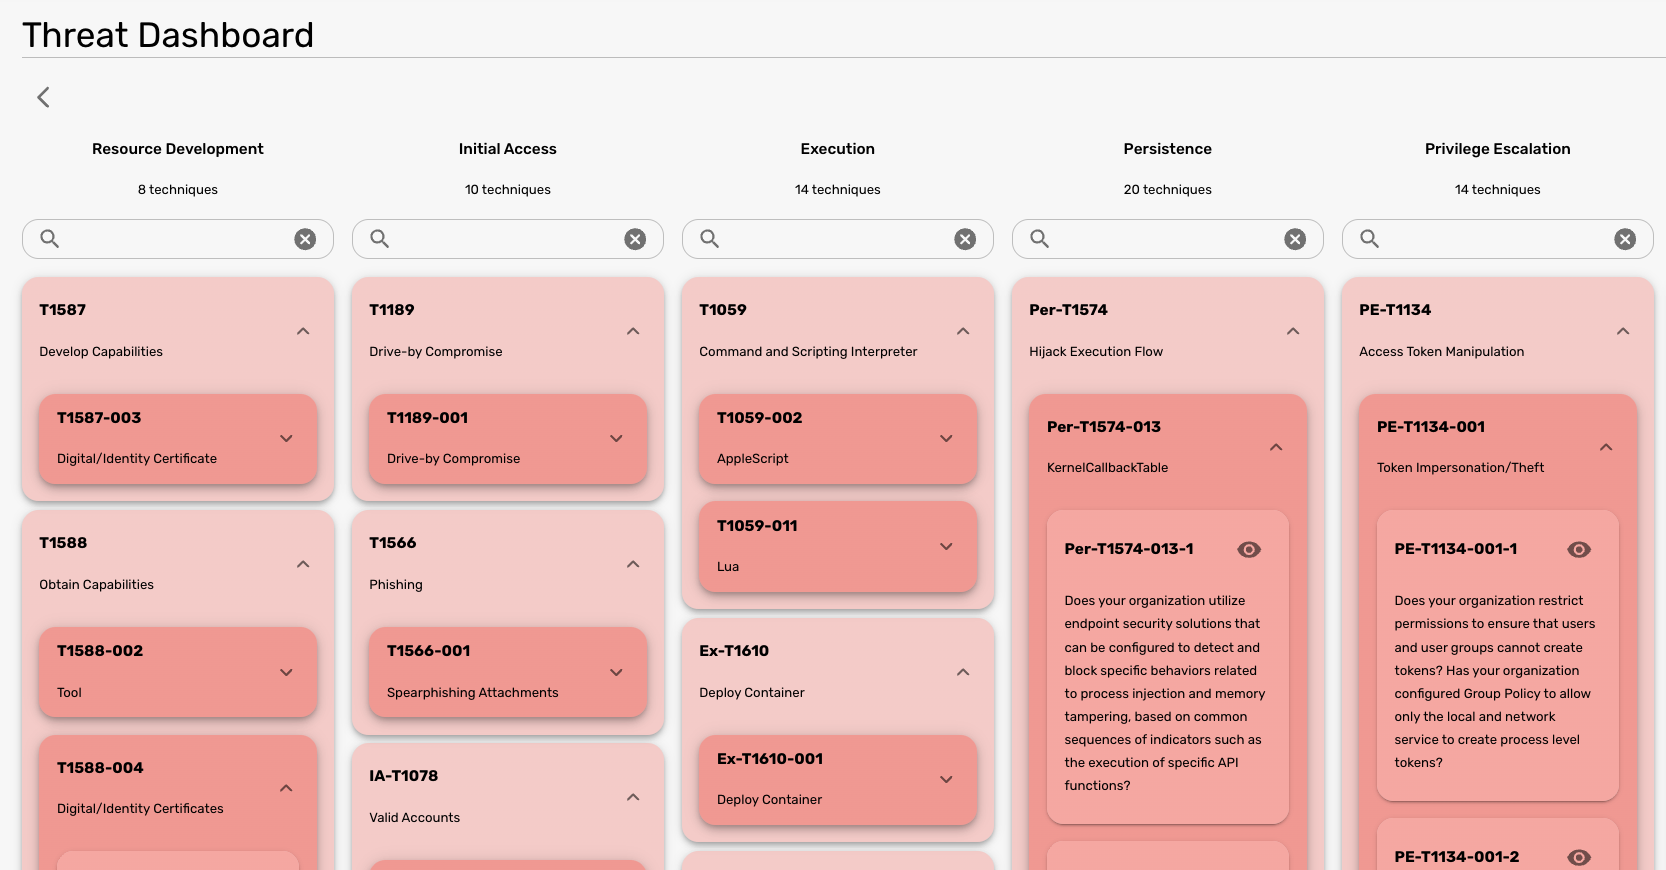
See exactly where your Controls hold, and where they fail
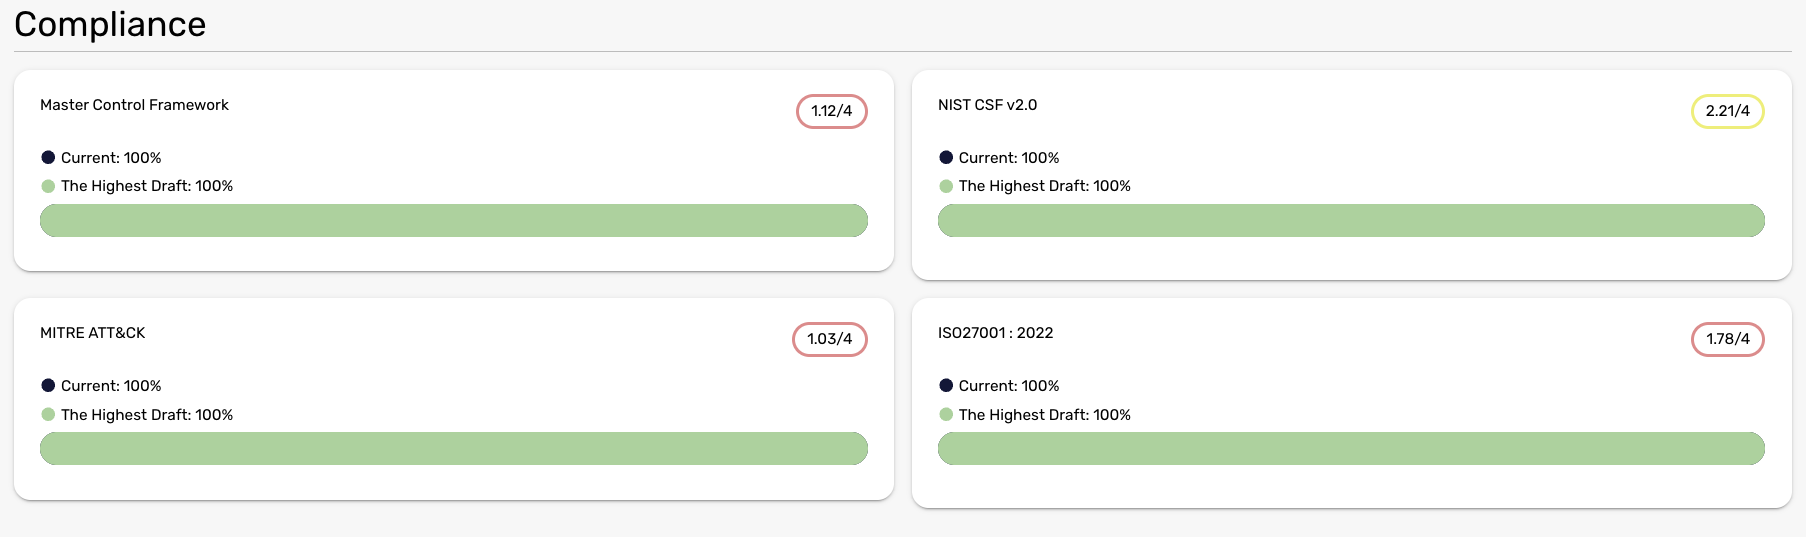
CyberHQ® maps your current control effectiveness against the MITRE ATT&CK framework, showing precisely which adversarial techniques your organization can and cannot stop. The gaps are named. The priorities are clear. And the evidence is defensible to a board and a regulator.
Every Simulated Attack Produces a Dollar Figure
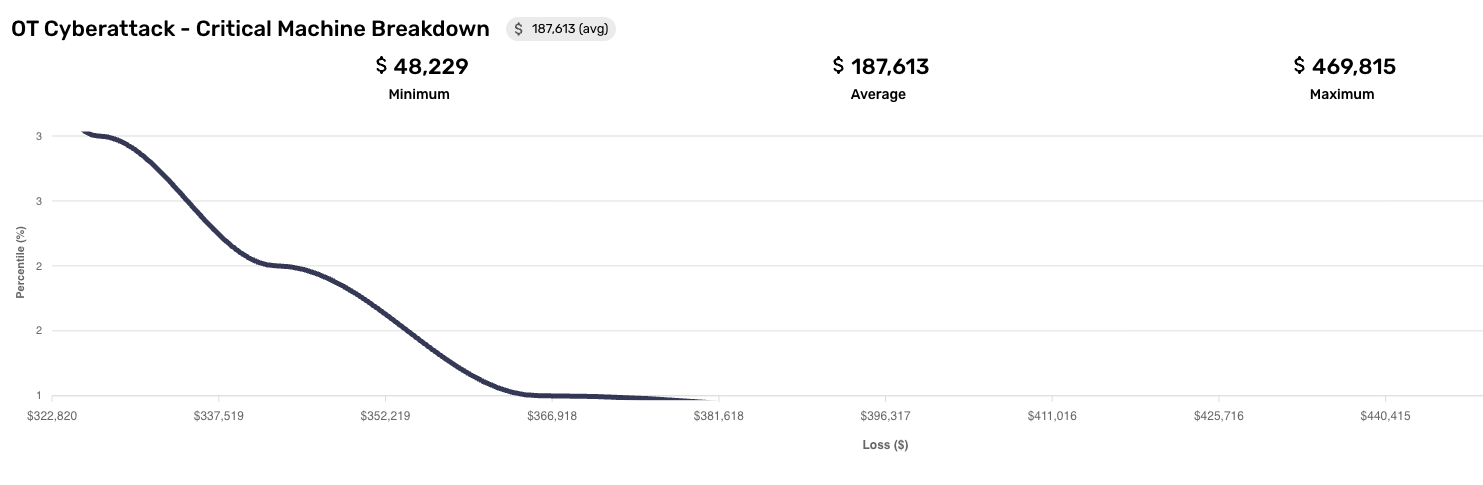
CyberHQ® connects each threat scenario to the business services it would disrupt and the financial exposure that disruption generates. The risk committee gets the cost of inaction. The CISO gets the case for investment. Both answers come from the same evidence layer.
Cost to Improve Controls
$1,456,000
Potential Financial Impact of Threat
$3,520,000
Return on Investment
$2,064,000
What Changes When You Model Threats in Business Context
Most organizations run threat modeling as a technical exercise: identify threat actors, determine TTPs, map mitigations, repeat. The process is disconnected from compliance, disconnected from financial exposure, and disconnected from the services that cannot afford to fail.
CyberHQ® embeds threat modeling into the risk lifecycle, connecting attack scenarios directly to the business services they threaten, the financial exposure they generate, and the controls that are or are not stopping them.
| Point-In-Time Security Reviews | Threat Modeling & Simulation with CyberHQ® |
|---|---|
|
Your team can only assume controls are working. There is often no evidence.
|
Control effectiveness is mapped against MITRE ATT&CK. Gaps are named, not assumed.
|
|
Threat profiles are generic. Your team is defending against industry averages, not the adversaries targeting your sector.
|
Attack scenarios are scoped to your environment, your threat actors, and your specific infrastructure.
|
|
Remediation is driven by CVSS scores. The highest severity finding gets the budget, regardless of whether it would actually reach a critical service.
|
Prioritization is by business impact and attacker likelihood of success, not by severity score alone.
|
|
Assessments happen once a year, in a workshop, with findings that are stale before the report is written.
|
Threat models update continuously, fed by live telemetry from your existing tools.
|
|
Security, compliance, and financial risk exist in separate reports. No one can see the full picture.
|
Attack scenarios, compliance posture, and financial exposure sit in a single evidence layer.
|
|
The board receives a technical summary they do not understand. The numbers are often inconsistent. Decisions are deferred.
|
Board-ready threat reports are generated automatically, in operational and financial terms the board can act on.
|
"CyberHQ® immediately elevates our executive and board reporting capabilities from 1 to 10."
Banking and Funds Management Company
AI-Driven Attack Simulation
CyberHQ® takes the threat actors and TTPs your team identifies as relevant to your sector and models how your current controls would hold against them. Each simulation outputs where your defenses are sufficient, where they fall short, and the operational and financial impact. Every scenario is grounded in your actual control data and environment, not generic industry averages.
Attack Path Analysis
CyberHQ® assesses how well your current defenses cover the TTPs your team has identified as relevant to your sector. For each technique in scope, the platform shows the strength of your defensive coverage and the exposure that remains, so you know exactly where your controls hold and where critical services are left at risk.
MITRE ATT&CK Control Mapping
Maps your control effectiveness against the MITRE ATT&CK framework, showing exactly which adversarial techniques your organization can and cannot stop. A precise, defensible gap analysis grounded in real-world attacker behavior.
Continuous Threat Intelligence
Build your attack scenarios in CyberHQ® and each one anchors to the business services and operational dependencies it would disrupt, showing which services are at risk, what recovery requires, and what the financial exposure amounts to. Prioritization reflects what the business cannot afford to lose.
Business Service Impact Mapping
Know which controls are in place and how effectively they defend each key business system against the threat scenarios in scope. For every TTP your team has mapped, the platform assesses the coverage your current controls provide at the organizational level, so your team understands where defenses are working and where business systems are left exposed.
Threat-Informed Board Reporting
Generates board-ready threat reports expressing attack scenarios in operational and financial terms, suited to risk committees, audit committees, and board-level investment decisions. The board gets the answer. Not the methodology.
Proactive Defense, Grounded in Your Real Threat Environment
Most threat modeling is an annual workshop. By the time findings are written up, they're stale. CyberHQ® runs continuously. Every connector feeds live telemetry into the threat model, every simulation reflects current control effectiveness, and every output is scoped to the attack patterns targeting your sector. When the board asks whether you're prepared, you already have the evidence.
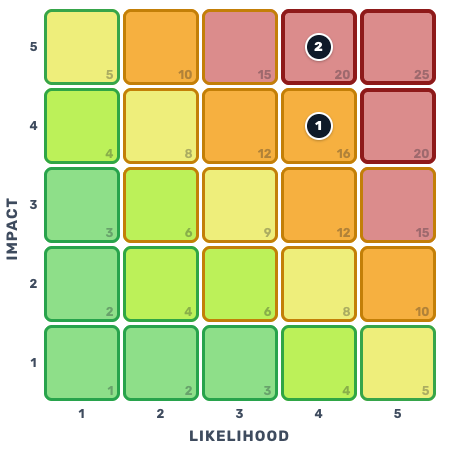
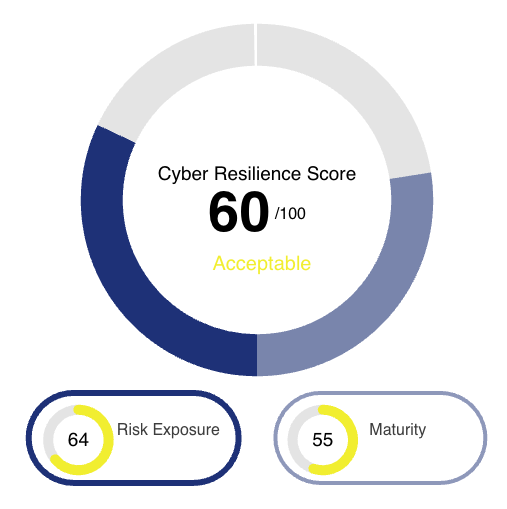
Simulated Risk Posture
Frequently Asked Questions
What is Threat Modeling & Attack Simulation?
Threat Modelling is process of identifying and prioritizing threat actors, attack vectors, and techniques most relevant to your organization. Attack Simulation is how those attacks would play out across your specific environment, and evaluating whether your current controls would stop them. CyberHQ® automates and continuously updates this process, tying simulation outputs to the business services and financial exposure that boards and risk committees need to govern effectively.
What is MITRE ATT&CK?
MITRE ATT&CK is a globally recognized framework that catalogs the tactics, techniques, and procedures used by real-world threat actors.
CyberHQ® maps your current control effectiveness against this framework, identifying exactly which adversarial techniques your organization is and is not prepared to stop. The result is a precise, defensible gap analysis grounded in actual attacker behavior.
How does CyberHQ® simulate attacks?
CyberHQ® assesses which controls are in place at the organizational level and how effectively they defend against the threat scenarios your team has mapped. For every TTP in scope, the platform evaluates your current control coverage and shows where defenses are working and where exposure remains.
How is this different from a SIEM or threat detection tool?
A SIEM tells you what happened. A threat detection tool generates alerts. Neither tells you which attack scenarios would disrupt your most critical services, what those disruptions would cost, or where to invest to reduce the most risk. CyberHQ® operates above your detection stack, using the data it already generates to model attack paths, quantify business impact, and produce the prioritized, financially grounded decisions your security program requires.
How does threat modeling connect to compliance and financial risk?
In CyberHQ®, threat modeling is not a separate exercise. Attack scenarios are mapped to the controls your compliance frameworks require, showing whether those controls are effective against the threats they are supposed to mitigate. Each scenario is also connected to financial exposure through CyberHQ®'s risk quantification capability, so the outcome of every simulation can be expressed in the terms your CFO, board, and cyber insurer require. Those outputs directly support prioritization and investment decisions, giving security leaders a financially grounded basis for where to act first
How does threat modeling connect to compliance and financial risk?
In CyberHQ®, threat modeling is not a separate exercise. Attack scenarios are mapped to the controls your compliance frameworks require, showing whether those controls are effective against the threats they are supposed to mitigate. Each scenario is also connected to financial exposure through CyberHQ®'s risk quantification layer, so the outcome of every simulation can be expressed in the terms your CFO, board, and cyber insurer require.
See CyberHQ® configured to your environment
Book a 30-minute interactive session to see how CyberHQ® integrates with your existing tools, frameworks and environment.
-1.png?width=500&height=112&name=avertro-white-logo%20(1)-1.png)