Skip to content

Make Every Security Decision Defensible

CyberHQ® translates threat scenarios, control gaps, and attack pathways into monetary exposure figures. Layer AI -driven modelling on top and you generate decision-grade recommendations that connect financial exposure to strategic investment priorities. 

Screenshot 2026-06-24 at 10.44.25 (1)

Annualized Loss Expectancy Per Scenario

Loss Exceeding Modeling

Scenario & Project Modeling

Threat Informed Financial Exposure

AI-Assisted Scenario Modeling

Decision-Grade Risk & Intelligence

Trusted by

St John WA Logo
QUT Logo
RDC AI Logo
Austrade Logo
Company Name
Company Name
Company Name
Company Name

Every Security Investment is Defensible

CyberHQ® turns every investment decision into a Security-per-Dollar calculation your CFO and board can interrogate. Know, with evidence, what impact on risk your investments have.

Implement MDR Program Chart

NIST CSF v2.0

Likelihood Maturity
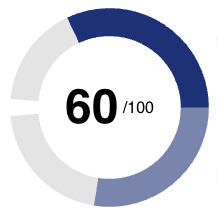
Likelihood: At Start 37, Current 37.8, Projected 38. Maturity: At Start 20, Current 55.26, Projected 57.

Implement MDR

Program to implement an MDR solution


Budget

$250,000

Planned Activity Cost

$72,500

Planned Program Effort

8 week(s)

Planned Activity Effort

8 week(s)

Planned ROI

$65,315 per point

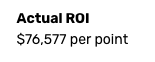
Actual ROI

$76,577 per point

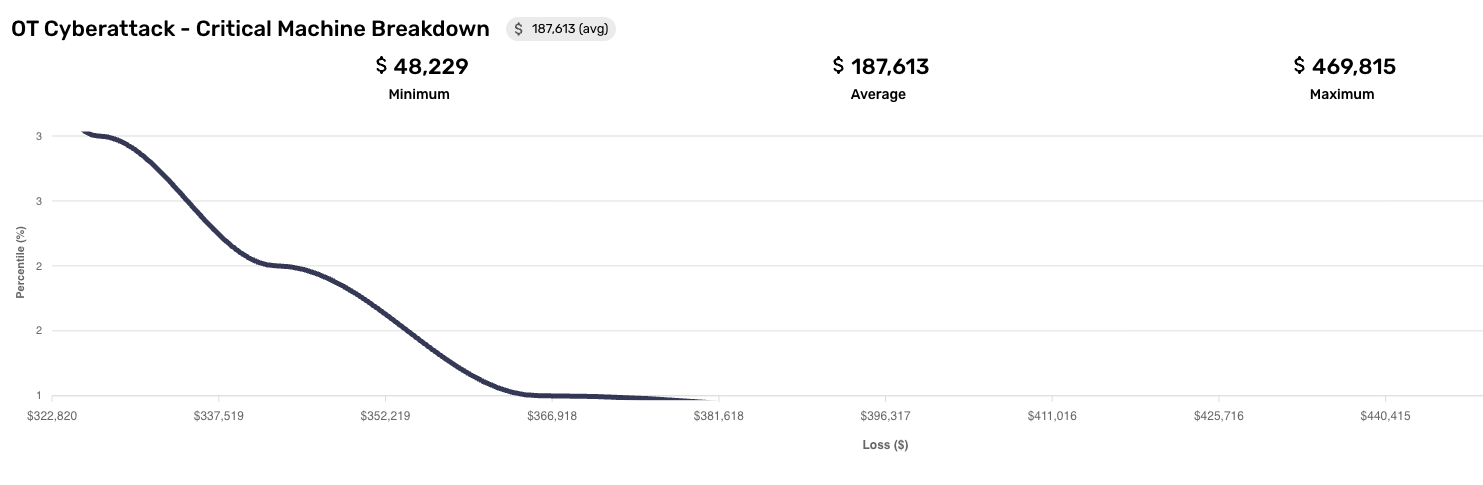
OT Cyberattack — Critical Machine Breakdown
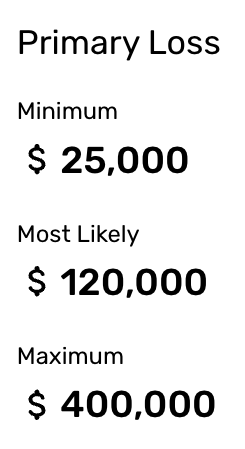
OT Cyberattack — Critical Machine Breakdown $187,613 (avg)
Minimum
$48,229
Average
$187,613
Maximum
$469,815
Loss ($)

Financial Exposure, Not Just Severity Scores

CyberHQ® quantifies every threat scenario as a dollar figure, not a red/amber/green rating. Each risk is expressed as an Annualized Loss Expectancy tied to real business services and your organization's own cost structures. The board gets a number. You get a defensible position.

Figures that Hold Up Under Scrutiny

Manual risk quantification produces different results depending on who runs it, when, and against what assumptions. CyberHQ® generates consistent, model-driven outputs grounded in your own cost structures and live data, so when the board or a regulator pushes back, the number holds.

Screenshot 2026-06-26 at 3.45.17 pm
Screenshot 2026-06-26 at 3.45.54 pm
Screenshot 2026-06-26 at 3.48.30 pm
Screenshot 2026-06-29 at 10.09.19 am
Screenshot 2026-06-29 at 10.09.12 am
Screenshot 2026-06-29 at 10.39.17 am

What Changes When You Quantify Your Cyber Risk


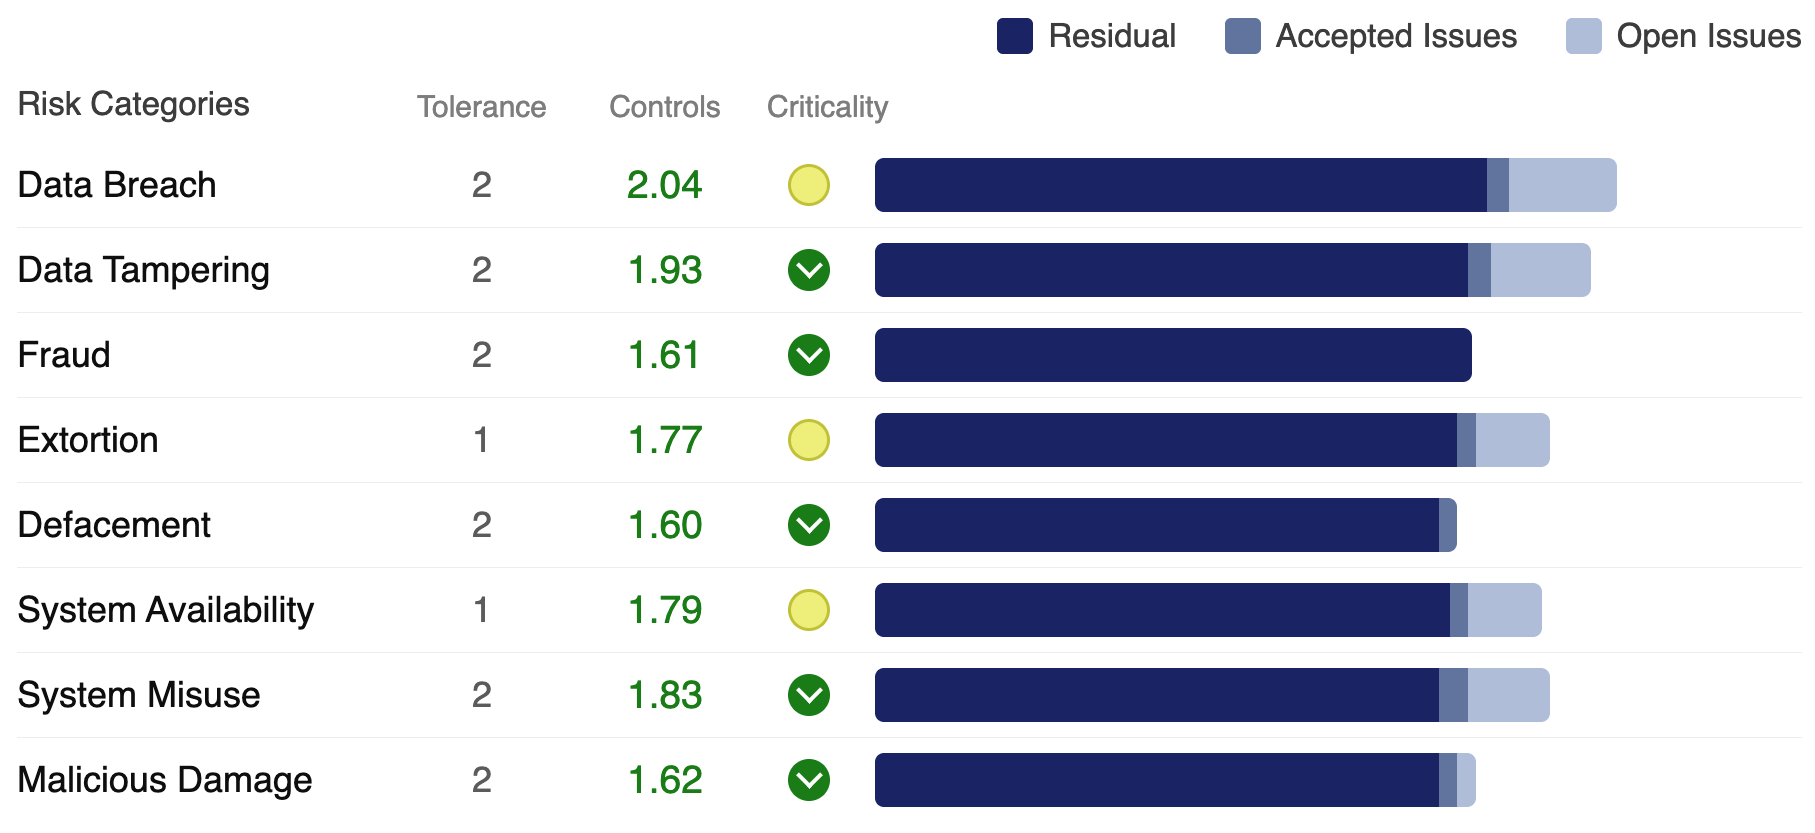
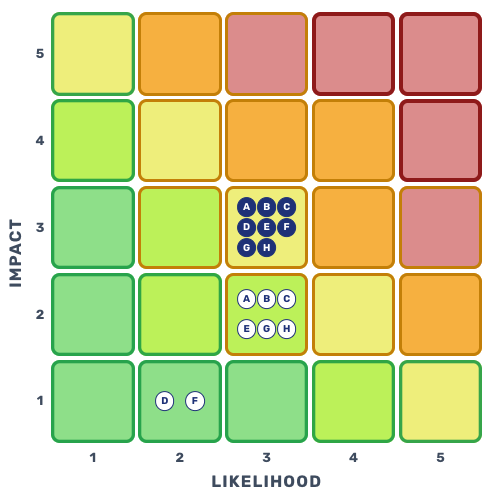
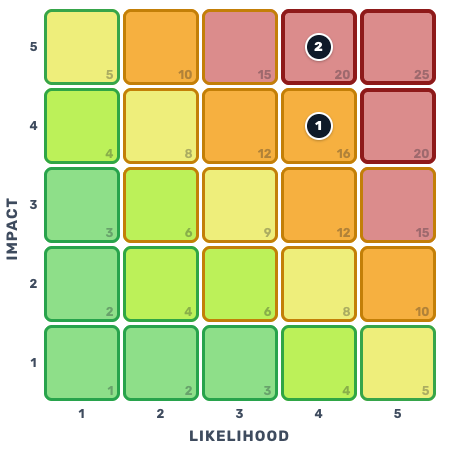
Most organizations still assess cyber risk in qualitative terms, heat maps, likelihood ratings, and control scores, outputs that are difficult to connect directly to budget decisions or board conversations about financial exposure.


CyberHQ® sits above these existing processes and continuously translates their outputs into financially-grounded Cyber Risk Quantification: connecting technical risk to the language that drives business decisions.

Only Qualitative Risk Assessments Cyber Risk Quantification with CyberHQ®
Budget approval challenges as the board cannot translate technical language into business decisions.
CyberHQ® translates every risk into financial exposure the board can interrogate and act on.
Risk rated as High, Medium, or Low with no financial anchor, a language the board does not understand.
Risk expressed as monetary exposure using Annualized Loss Expectancy.
Likelihood and impact assessed subjectively, varying by assessor.
Loss distributions modelled probabilistically via Monte Carlo simulation: consistent, auditable, and repeatable.
A red, amber, and green dashboard that the board acknowledges and immediately forgets.
Board reporting in financial exposure per threat scenario, not just red, amber, and green.
Security spend justified by severity rankings the business cannot connect to financial outcomes.
Investments justified by projected risk reduction per dollar (Security-per-Dollar).
Scenario planning is a manual exercise that produces different results every time and cannot be defended.
What-If modelling run continuously against live risk data.
No AI layer to connect financial exposure to prioritized investment decisions.
Avertro Intelligence generates decision-grade recommendations from your quantified risk data: transparent, auditable, and defensible.

"CyberHQ® immediately elevates our executive and board reporting capabilities from 1 to 10."

Banking and Funds Management Company

Key Capabilities

Maze-Strategy--Streamline-Ultimate

Annualized Loss Expectancy Per Threat Scenario

CyberHQ® calculates Annualized Loss Expectancy (ALE) for each threat scenario using industry loss models and your organization's internally defined cost structures. Every figure is tied to a specific business service, making financial exposure visible.

analytics-mountain

Loss Exceedance Modeling

CyberHQ® runs each scenario 10,000 times using Monte Carlo simulation to calculate the likelihood of different levels of financial loss. You get a full loss exceedance curve, not a single-point estimate, giving your risk committee the statistical confidence they require for capital allocation and investment decisions.

Checklist--Streamline-Ultimate

Scenario & Project Modeling

The What-If engine lets you simulate the financial impact of any proposed security investment before committing spend. Define a project, model the risk reduction it delivers, and express the outcome in dollars removed from the balance sheet. Every investment decision becomes defensible.

performance-money-decrease

Threat-Informed Financial Exposure

CyberHQ® connects financial exposure directly to the threat scenarios that matter most to your organization: ransomware on cloud systems, supply chain compromise, OT disruption. Each scenario is modelled using your real environment and business context, so the financial exposure figures reflect your actual risk profile, not a generic baseline.

optimization-graph-line

AI-Assisted Threat & Scenario Modeling

Avertro Intelligence simulates real-world attack scenarios and threat pathways, mapping attacker behavior to controls, vulnerabilities, and business services. Every scenario is evaluated in terms of business impact, giving security leaders the financial context to prioritize with confidence, not instinct.

seo-search-graph

Decision-Grade Risk Intelligence

CyberHQ® does not rely on black-box AI. Avertro Intelligence combines advanced analytics, machine learning, and AI-assisted modelling to generate transparent, auditable investment recommendations. Every output is designed to be interrogated by a CFO, defended in front of a board, and acted on with confidence.

Board-Ready Risk Reports On-Demand

Most security reports tell boards what happened. CyberHQ® tells them what it costs. The platform generates board-ready reports built around the outputs that financial decision-makers actually need: ALE figures per threat scenario, loss exceedance curves for capital allocation, and What-If scenario outcomes that justify every dollar of security spend before it is committed. Every report is designed to be interrogated, not just received.

Screenshot 2026-06-29 at 10.34.01 am-1
Screenshot 2026-06-25 at 5.52.09 pm

75%

reduction in manual compliance effort

90%

reduction in compliance costs

100+

integrators & connectors

20+

supported compliance frameworks

Frequently Asked Questions

What is Cyber Risk Quantification?

Cyber Risk Quantification (CRQ) is the process of translating cyber threats and control gaps into concrete financial terms. CyberHQ® uses industry-standard loss models, including Annualized Loss Expectancy, combined with your organization's own cost structures to produce financial exposure figures your board and risk committee can act on.

How does Scenario and Project Modelling work?

The What-If engine simulates the financial impact of a proposed security investment before you commit spend. In a Program, model control improvements and get an ROI figure measured as spend per point improved. In Threat Modelling, add or remove controls to see the impact on both cost of improvements and annual loss expectancy.

How does CyberHQ® calculate financial exposure? 

CyberHQ® calculates financial exposure by estimating how often an event is likely to occur and how costly each occurrence would be. This produces an Annualised Loss Exposure: a single number representing your expected annual financial risk from that scenario.

Who is Cyber Risk Quantification designed for?

CISOs who need to defend security spend with financial precision, CROs quantifying cyber risk in business terms, and risk committees requiring quantified exposure data for capital allocation and board governance.

What is Loss Exceedance Modelling?

Loss Exceedance Modelling uses Monte Carlo simulation to calculate the probability of experiencing different levels of financial loss across thousands of scenarios. Rather than a single-point risk estimate, you receive a probabilistic distribution that quantifies tail risk: the data your risk committee and capital allocators require for informed decisions.

How is CRQ different from traditional risk scoring?

Traditional risk scoring assigns qualitative ratings, high, medium, low, based on likelihood and impact assessments that can vary by assessor and carry no financial weight. CyberHQ® sits above this and transforms those assessments into monetary exposure figures grounded in historical data from your own organization and broader industry research and reporting and industry loss models. Every risk carries a number your CFO can interrogate and your board can act on.

See CyberHQ® configured to your environment

Book a 30-minute interactive session to see how CyberHQ® integrates with your existing tools, frameworks and environment.